Methodology
In 2005, after becoming aware of a number of quantitative stock picking systems that had very successful track records, Paul Cormier, who is now president of Cormier Strategy Advisors, began research on whether similar principles could be applied to broader market indices. He explored a number of fundamental and technical indicators to determine whether their movements exhibited predictive power over future market movements.
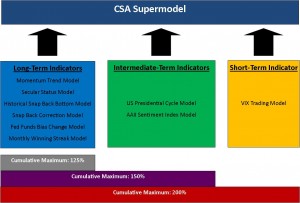
After much research and testing, the CSA Market Timing Indicator was developed. The Indicator is based on the CSA Supermodel which in turn is based on nine sub-models.
Momentum Trend Indicator
This model is based on identifying market trends and the current relationship of the market to the trend. The concept is to invest when the trend is positive, avoid the market when the trend is neutral and short the market when the trend is negative. This model will not identify exact tops and bottoms, but is geared towards moving in or out of the market in time to take advantage of the great majority of a bull market or bear market and thus gain most of a bull market’s gains while avoiding most of a bear market’s losses.
Secular Valuation Model
The market is assessed based valuation versus its long-term return potential taking into account economic output (GDP), 10-year Treasury Yields and 3-month T-Bill Yields to generate an overall score. It’s long-term return potential determines its relative rating.
Historical Snap Back Bottom Indicator
This is the indicator that we use to try to judge where to get back into the market after very severe market declines. This indicator correctly identified the market bottom in March 2009. This indicator only works after mega-meltdowns in the market so hopefully we won’t need to use it for a while.
Snap Back Correction Model
Using information from the same model as the Historical Snap Back Bottom indicator, a model has been developed which has forecasted some major bull market corrections. It rarely gives a signal, but when it does it has been extremely accurate at identifying coming market corrections.
Fed Funds Bias Change Model
When the US Federal Reserve changes its monetary policy bias (from stable to easing, for example), our research shows that it is very difficult to predict how the stock market will initially react. However, we have detected a notably consistent pattern of market movement in the period between months 4 and 12 after such an event. This model allows us to increase or decrease equity exposure on that basis.
Monthly Winning Streak Model
The S&P 500 has a consistent performance profile after long periods of success. This model uses that performance profile to adjust equity weightings.
US Presidential Cycle Model
We rarely advocate seasonal models in our work. They are generally not consistent enough to rely upon. One exception is the US Presidential Cycle. Certain periods in the US presidential cycle exhibit substantial performance or underperformance on such a consistent basis as to be worth adjusting investment timing decisions. Only those periods that exhibited both substantial variation from mean performance and on an extremely consistent basis were chosen for investment.
AAII Sentiment Index Model
When investor sentiment moves to extremes, markets usually move in the opposite direction. We have identified specific criteria that have been associated with past strong market moves. This indicator can recommend positive (when pessimism is extreme) or negative (when optimism is extreme) weightings.
VIX Trading Model
This indicator attempts to identify short-term periods of positive market performance based upon readings in the Volatility Index (VIX). This indicator is more stringent in its buy criteria the worse the long-term status of the market and less stringent in sell criteria the better the long-term status of the market. The criteria result in an average return of 2.6% per signal, with 80% of total signals correct and an average of 3.7 signals per year, back-tested to the beginning of 1992.
Weightings are calculated as follows:
- The weightings based on the long-term indicators are added. The result must be between +125% and -100%. Results above this range are adjusted down to +125% and results below the range are adjusted up to -100%.
- The result is then added to the intermediate-term indicator weightings. This result must be between +150% and -100%. Results above this range are adjusted down to +150% and results below the range are adjusted up to -100%.
- The result is then added to the short-term indicator weighting resulting in a maximum rating of +200% and a minimum rating of -100%.
To be at a maximum bullish rating of +200% we need to have long-term, intermediate-term and short-term signals all simultaneously bullish.
The change in the Supermodel rating must be more than 25 percentage points before we make a change in the asset allocation portfolios to reduce the number of overall trades being placed to a reasonable level.

